Outliers your IC will see before the thesis breaks.
Capital Refinery grades every position against firm policy on a unified KPI backbone. Risk Signals scoreboard, Covenants & Breach by proximity to break, and outlier detection that connects today's deviation to the entry assumption it invalidates — so the team finds out with the time still left to act.
Covenants & Breach — proximity to break across the portfolio.
Every position ranked by how close it is to a covenant break, a thesis trigger, or a firm-policy threshold. Click any row, see the outlier and the source.
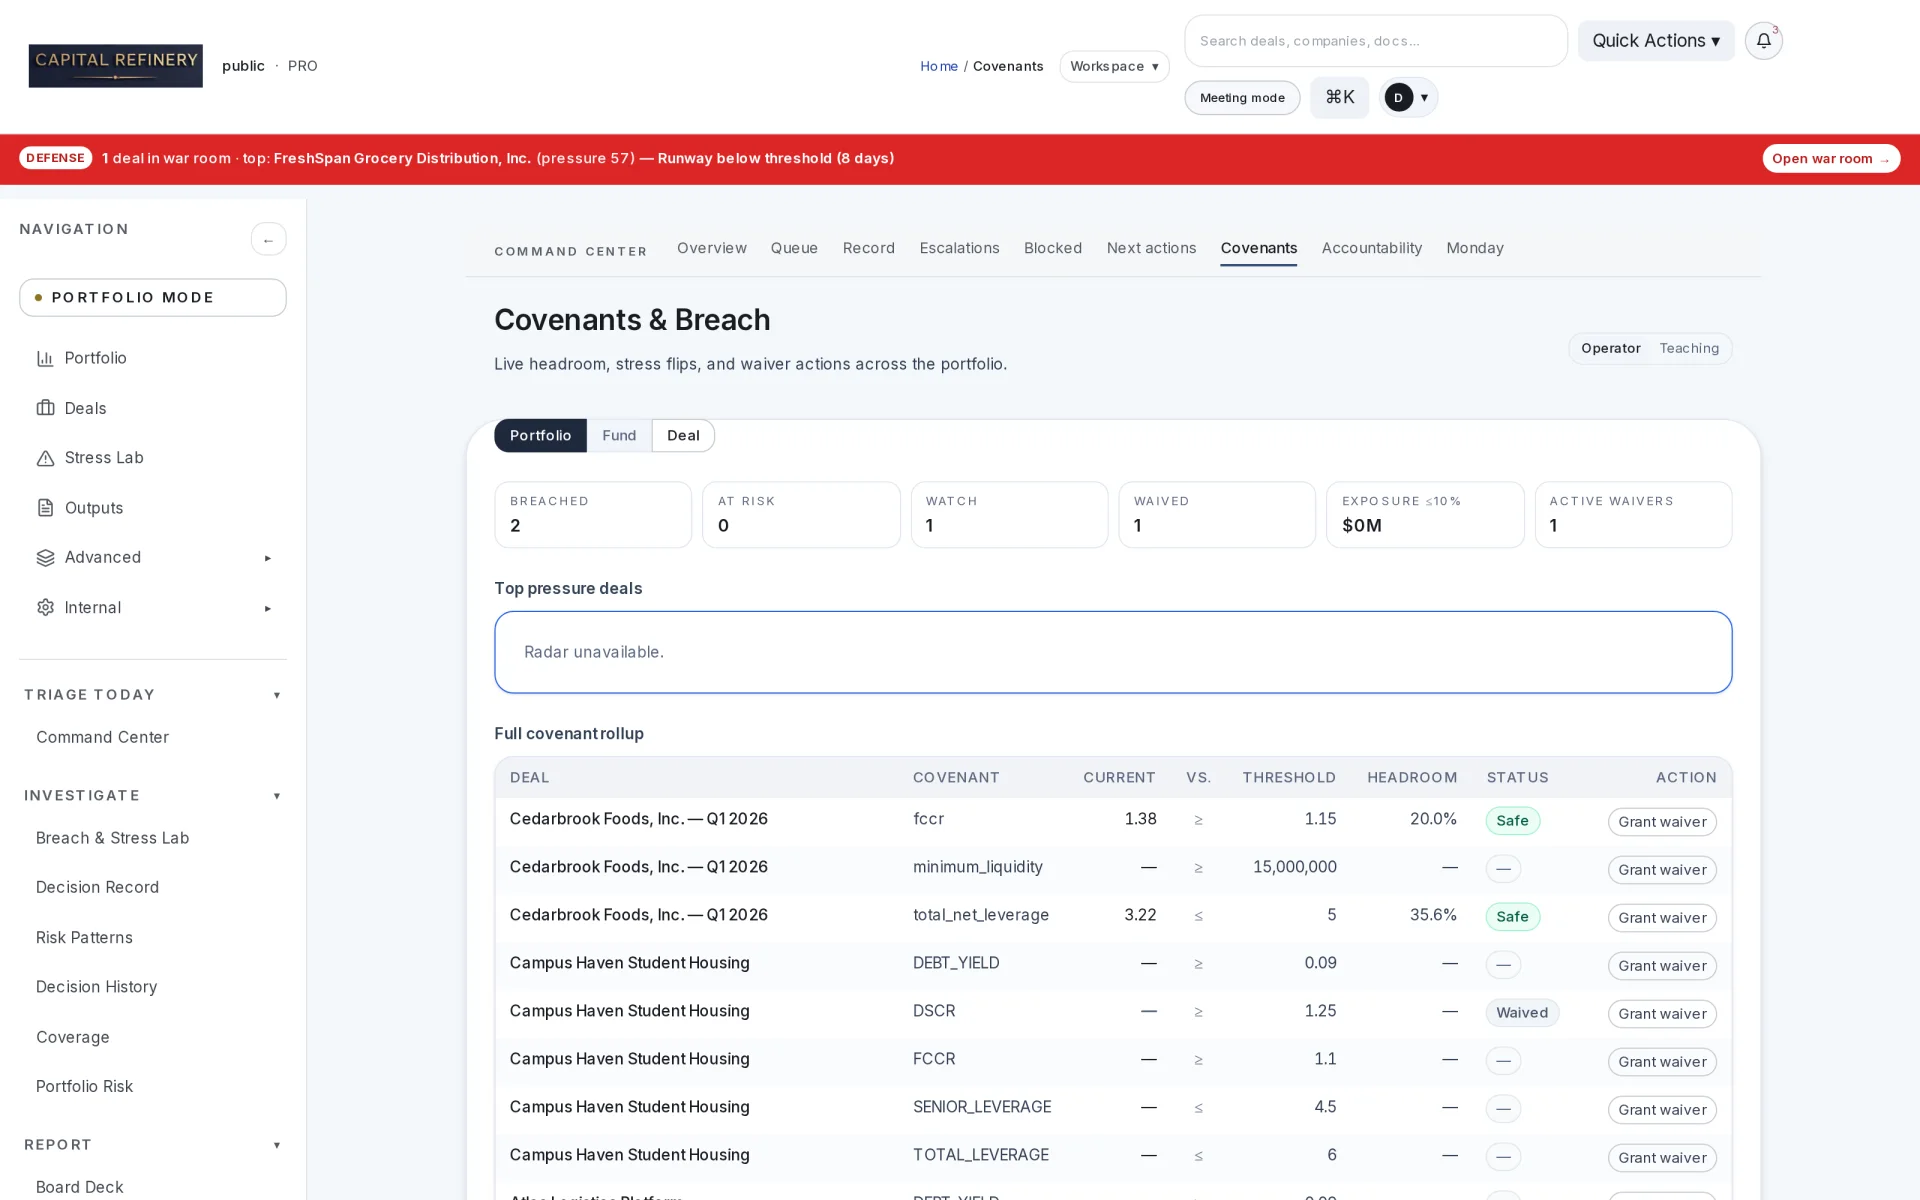
We won't average across regimes silently. When a portfolio covenant rollup mixes corp-PC DSCR with RE-PC DSCR + LTV + DebtYield, the surface tells you — per-lane weighted share and an advisory hint. The banner suppresses on homogeneous portfolios (>90% single lane). A "3.42% within 10% of breach" number that quietly mixes two covenant regimes is not the answer.
Why benchmarking actually fails today
Most firms cannot benchmark accurately because data arrives in incompatible formats: different COA structures, inconsistent reporting cadences, varying definitions of the same KPI, analyst-specific adjustments. The benchmarking layer sits on top of that fragmented data and surfaces noise as signal.
Capital Refinery normalizes the data first — into a unified KPI model with a candidate trail back to the source cell. Benchmarking and outlier detection sit on top of structured data, not on top of spreadsheet stitching.
What gets surfaced as a Risk Signal
- Margin deviation relative to the entry assumption — not just relative to peers
- Working capital distortion that signals cash pressure
- Revenue quality concerns: concentration, churn, customer deterioration
- Debt service abnormalities and early covenant headroom compression
- Lease or tenant anomalies hidden inside rent rolls
- Cap-strike gap where the hedge is no longer protecting the position
- Expense creep tracked T-3 vs T-12 against firm policy
Each signal carries observed value, firm threshold, and verdict — and clicks back to the source document. No black box, no narrative reconstruction.
Cohorts that actually mean something
- Lane-aware peer comparison (corp PE, private credit, RE-PC, RE-CRE, hybrid)
- Industry cohorts within lane
- Size cohorts by revenue, EBITDA, GAV, or unit count
- Vintage cohorts for fund-level comparability
- Strategy cohorts within fund family
Cohorts update as new data ingests. Re-grade once when firm policy changes; every existing memo reflects the new standard on the next render.
Detecting the patterns that don’t look like outliers
The harder cases — what the team usually catches too late:
- Revenue smoothing designed to mask volatility
- Suspiciously static expense lines that don't move with volume
- Inventory or AR patterns that indicate stress before the income statement shows it
- Sudden jumps in normalized EBITDA adjustments
- Tenant rollover concentration in the next 12 months that the rent roll buries
- Debt/interest patterns inconsistent with the rate environment
Who this is built for
- PE firms running buy-and-build where outliers across portfolio companies signal which thesis is breaking
- Credit funds where covenant headroom and DSCR runway have to be visible before the next reporting cycle
- Operators who need outlier-driven prioritization, not yet another dashboard to ignore
- LPs and audit committees who need to see comparability across funds and vintages
See outliers on a real position from your portfolio.
No demo data. Bring us a deal pack and a quarter of operator updates. Same-day diagnostic showing every Risk Signal graded, every outlier source-backed, every breach mapped to the entry assumption it invalidates.